Predictability data in maps
Goal
Parkmobile was a digital solution for paid parking working in Netherlands and Belgium, with 2 million monthly active users. All journeys start from the map, and as a result of an acquisition, we now accessed parking availability information on a street level. My job was to introduce this in the user journey, in a clear way.
Outcome
The Find & Park feature was shipped after one quarter of discovery and development, but was only used by around 4% of the user base, under performing.
Early research surfaced a mismatch with the common users’ journey. It also lead to usability improvements and better data display. The experience got better, but adoption struggled.
My contribution
The technical solution was already available on the map, as a result of the acquisition of the start-up that built it. The first step was to analyse this and any previous research they’ve done. Its visualisation lacked clarity, and risked confusing just trying to select a parking location and pay. All of their research had positive feedback from users, which raised a bit of a concern, potentially indicating biased results.
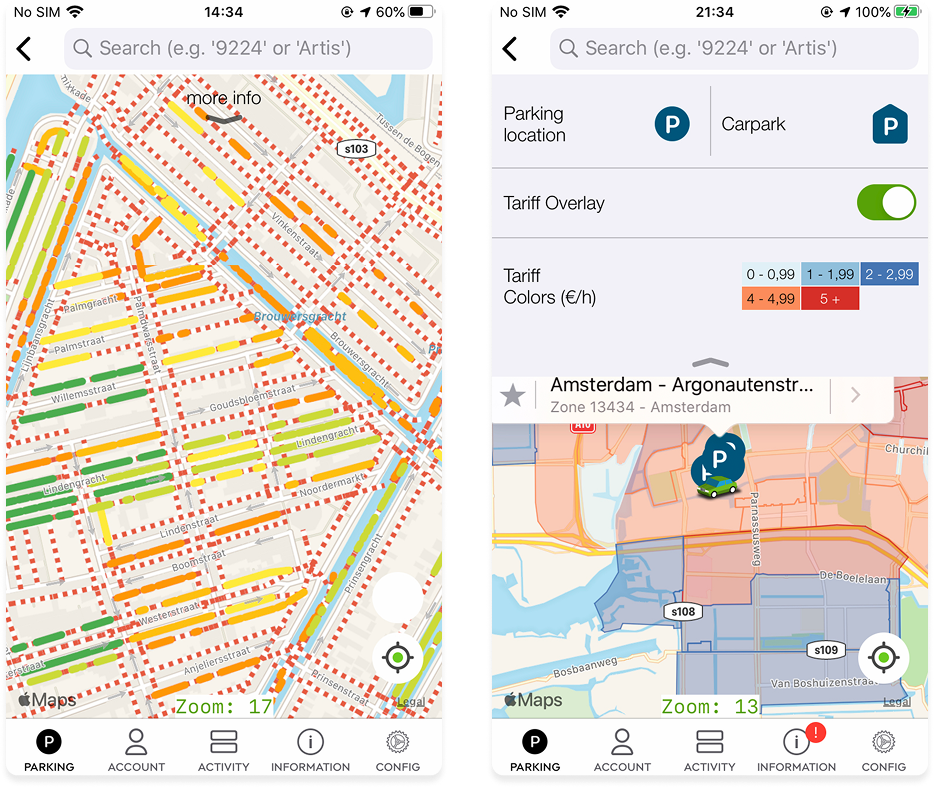
The first tech. showed non parking areas with red and white lines, and then used 5 colours for 5 levels of availability. Overwhelming…
The map already had a tariff overlay appreciated by users, in production and a tariff overlay.
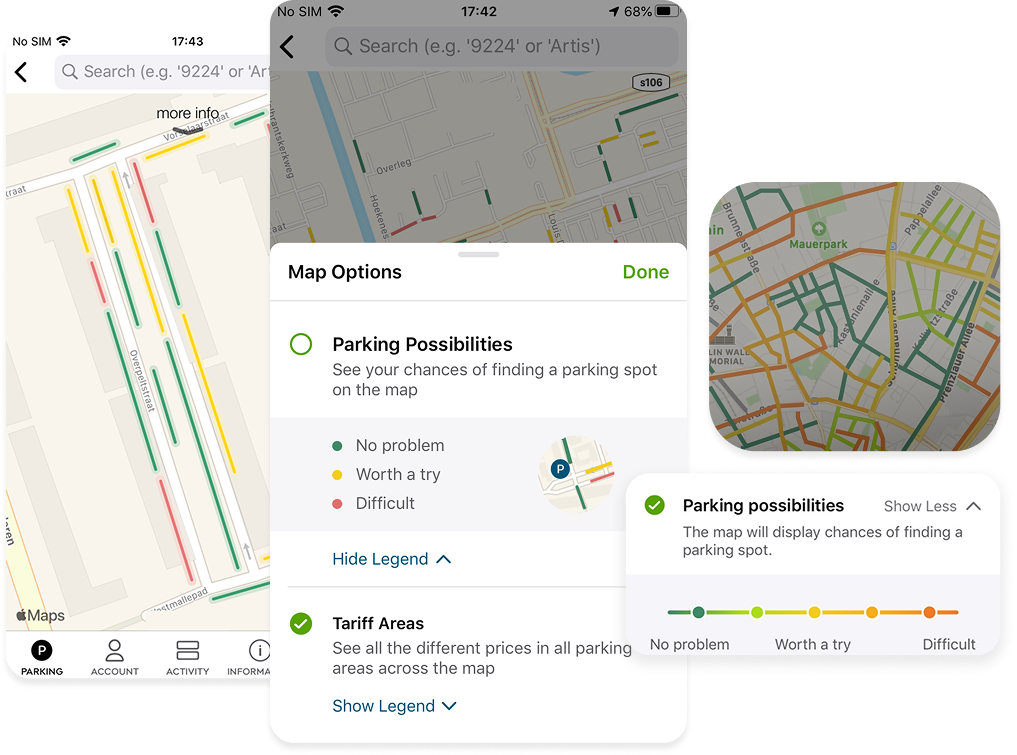
I realised that there were two main areas to work on. Firstly, the visual layer itself: displaying line segments at different zoom levels and locations on the map needed a lot of attention. This also had to be consistent with an existing map overlay: showing colour coded tariff areas. This tariff overlay was appreciated and used by people, as a quick was to scan how much they’ll be paying for parking.
Secondly, this new feature had to be added as part of the map settings to be switched on/off, and be explained for those seeking more details. There already was a map legend, but it focused on a single feature, it looked dated and was hard to discover.
To earn more time to explore these aspects, we ran a few user interviews using the current solution; showing the rest of the organisation the risk of shipping the technical solution as it was. As assumed, research validated these risks.
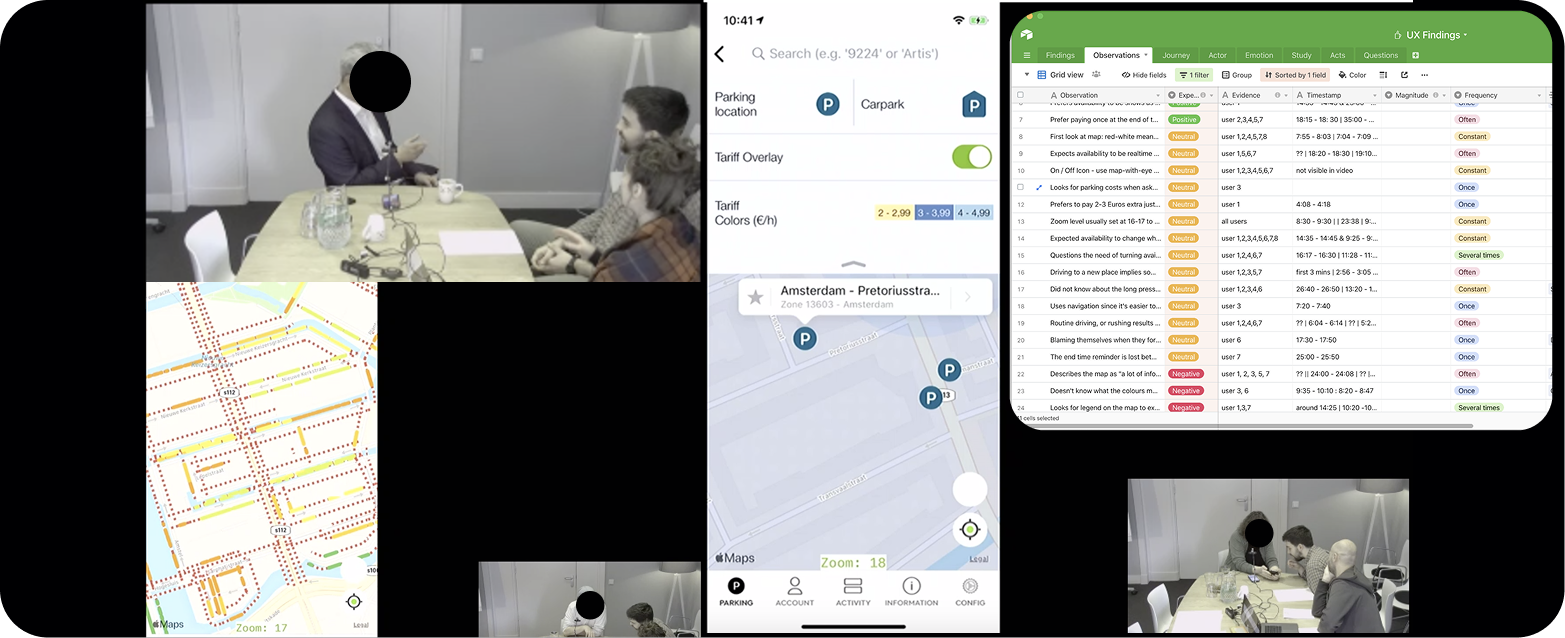
The most important insights surfaced adoption challenges. People liked the feature, seeing parking availability sounded great, but they’d never use it. Most people, most of the time, drive to a location, park and only then use the app to pay, with very little planning in advance.
Find & park, in its current form, was not part of the most common user journey.
We captured many insights around usability improvements as well: the red and white lines were overwhelming, but understood as no parking, and colour was generally overused, many people confused it with traffic. Validating quantitative data, the current legend was invisible to absolutely all participants; the trigger point was simply too hidden, easy to overlook.
While raising the user journey adoption risk to senior designers, I’ve continued exploring better ways of displaying this data on the map at different zoom levels, line thicknesses, and ways to trigger it. I’ve worked more closely with engineers to understand back end and front end constraints as well, by sharing prototypes.
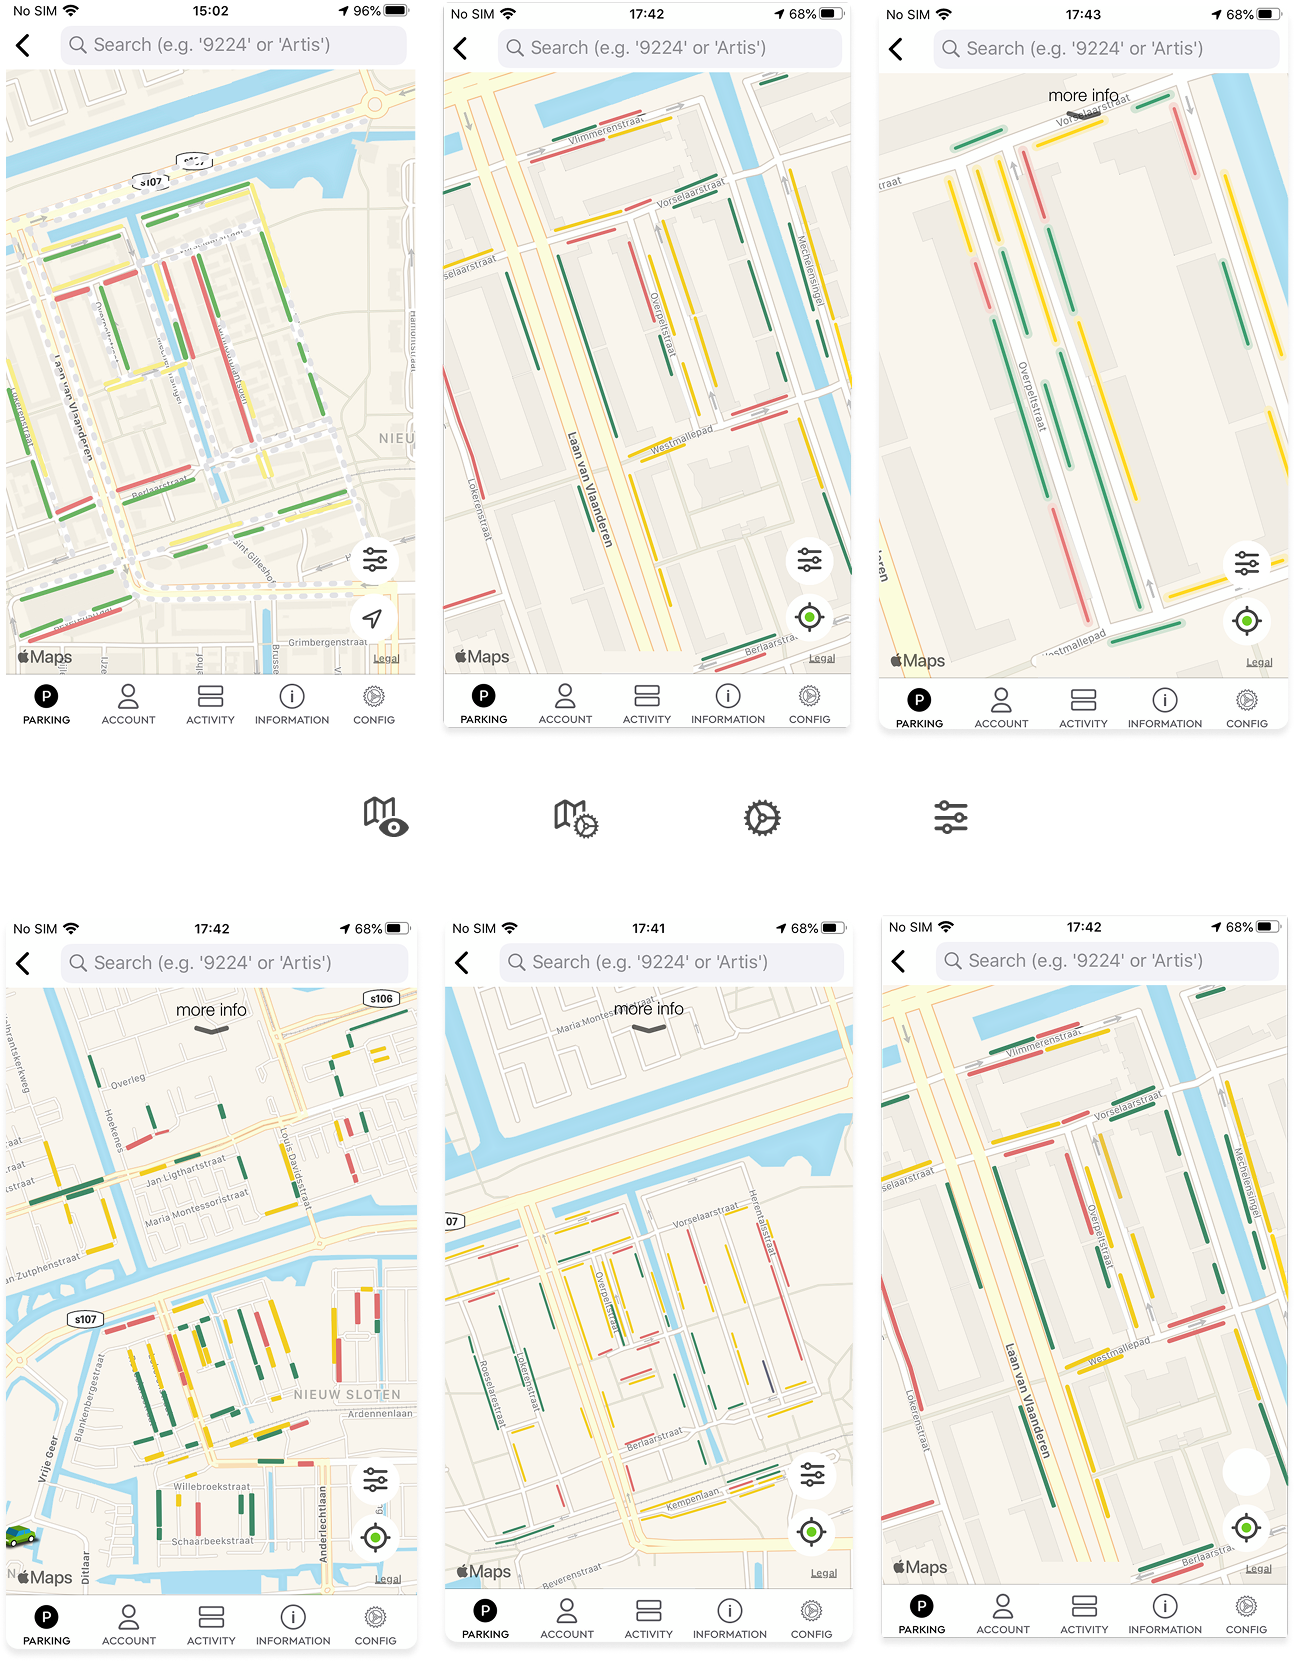
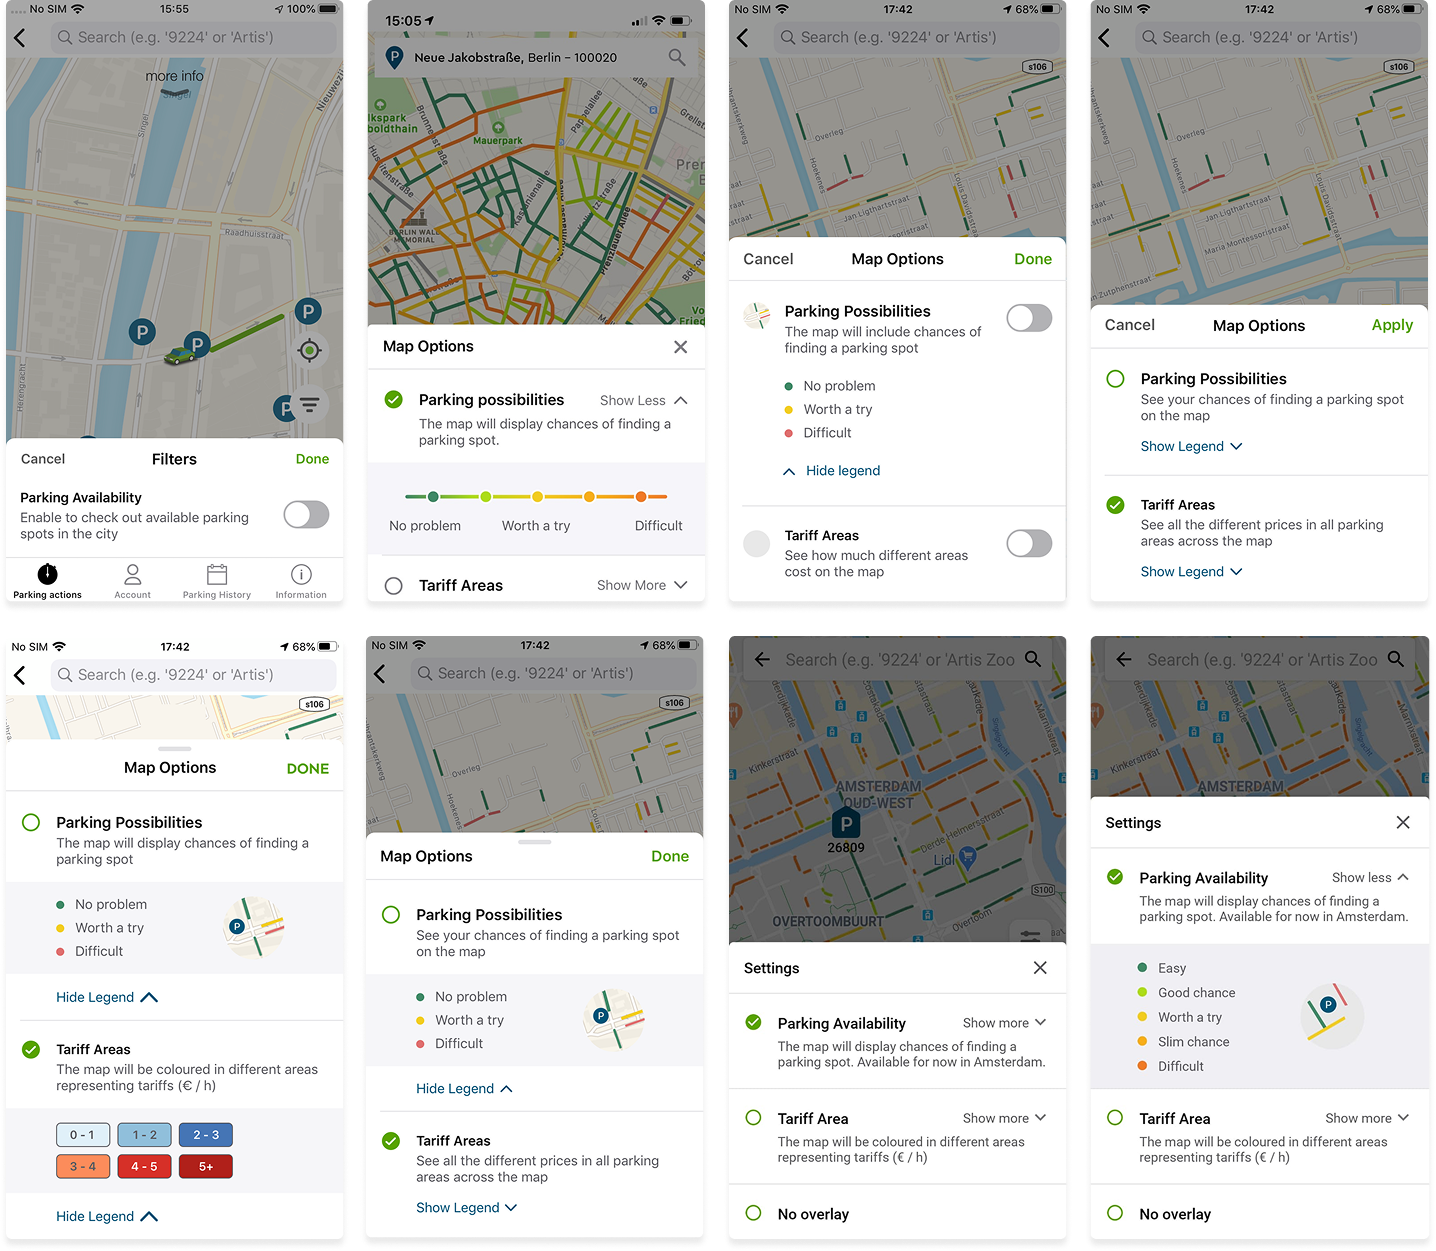
iOS and Android screens above. There was a strong push from stakeholders to show 5 levels of availability. While the UX team aimed for 3, it didn’t become a blocker to release the feature. Having no layer at all was an option too.
Ultimately, many of the usability improvements above were shipped; improving both the map visuals and this settings sheet.
The user journey, however, didn’t change, so adoption remained low. I explored a few ideas in which the app would recommend specific areas or locations, based on users’ location history. This would happen in a parking location page (shown as an alternative), or push notification timed at the right time of day, when we’d know they usually park…“Parking looks better on Haarlemmerweg 12. It’s 2 min from your usual spot”.
These were not implemented at all. I’ve re-used ideas later, when working at EasyPark, in the context of automotive design. Parking availability while getting close to the destination was a much better fit to users’ journey.
Things I learned
- Internal biases can lead to implementing the wrong feature in a good, usable way. I can explore availability in the app forever, but it might never be used.
- Usability tests with a map must be done using prototypes. Many participants tried to pinch a static figma screen shown on a test phone. Also, don’t use expensive test phones…
- Politics lead to confusion on this one. Too much involvement at the wrong level; all the attention could’ve been focused on creating a better user journey, figuring out the target group, trying out other ways to use this data…